
Why Multi-Physics Measurement Delivers Better Insight Than Vibration Monitoring Alone
Ask most reliability teams how they monitor their critical rotating assets and the answer is usually some version of "we run vibration." That answer made sense for a long time. Vibration analysis is mature, well understood, and genuinely good at what it was designed to do.
The problem is that in a lot of plants, vibration and condition monitoring have quietly become the same word. They are not. Vibration is one measurement domain among several that determine whether a fault gets caught early, caught late, or caught by the failure itself. Teams that have added other measurement domains alongside vibration are finding more failure modes, finding them sooner, and arguing about them less.
Table of Contents
- What Vibration Was Built to Find
- The Blind Spots Outside the Vibration Domain
- The Timing Gap Inside Vibration Itself
- A Second Pressure: Expertise Is Walking Out the Door
- What Multi-Physics Monitoring Actually Means
- Measurement Domains Compared
- Coverage Math: 22 Failure Modes on One Motor
- Two Stories From the Field
- Why AI Needs More Than One Signal
- Getting Started With Multi-Physics Monitoring
What Vibration Was Built to Find
None of what follows is an argument against vibration analysis. Vibration monitoring quantifies mechanical severity, identifies fault types from characteristic defect frequencies, and trends progression over time so you know whether a condition is stable or getting worse. For imbalance, misalignment, looseness, and bearing or gear defects, it remains the right tool and it is not going anywhere.
The question worth asking is different. It is not whether vibration works. It is what happens to everything that develops outside the mechanical domain.
The Blind Spots Outside the Vibration Domain
Electrical degradation. Stator winding faults, cracked rotor bars, insulation breakdown, and arcing are electrical events first. They frequently develop for weeks or months before producing any mechanical signature an accelerometer can see. Electrical signature analysis and EMI monitoring see them while they are still electrical.
Lubrication chemistry. Oil debris, viscosity loss, and water ingress show up in oil analysis long before the affected bearing starts to vibrate. By the time vibration reacts, the chemistry has already been wrong for a while.
Thermal behavior. Frictional heating and electrical hot spots register immediately in infrared thermography. Vibration may not respond until the underlying damage is well advanced.
The real cost of these gaps is not a missed alarm. It is false confidence. A flat vibration trend reads as a healthy machine, and the team believes it, while insulation degrades or lubrication contaminates in a domain nobody is measuring. The first signal anyone sees is the failure.
The Timing Gap Inside Vibration Itself
There is a second gap, and it exists even in programs doing vibration well. Route-based monitoring on a monthly or quarterly cycle samples the machine at fixed points in time. Bearing damage accelerates sharply in the final ten percent of service life, which is exactly the window where intervention is cheapest and where periodic sampling is least likely to be looking.
A machine can read healthy on the last route while degradation is already accelerating. Nothing about that is a failure of vibration analysis. It is a failure of sampling frequency, and it compounds the domain blind spots above.
A Second Pressure: Expertise Is Walking Out the Door
Most condition monitoring programs that genuinely work today were built around a handful of analysts who simply know how to read the data. They can separate a real fault from a transient resonance, and a sensor problem from a machine problem, because they have spent twenty years looking at the same fleet of assets.
That knowledge is tacit, it is enormously valuable, and it is retiring. The engineers replacing them are technically capable but do not have two decades of accumulated judgment on that specific equipment. Programs built on the veteran analyst are now exposed in predictable ways: more false positives clogging the work management system, more real faults lost in the noise, and less organizational confidence in every diagnostic call.
Hiring harder does not fix this. Waiting for the next generation to develop the same instincts on the same machines is not a plan either. What does help is a measurement architecture where signals corroborate each other, so a diagnostic call does not rest entirely on one person's pattern recognition.
What Multi-Physics Monitoring Actually Means
Multi-physics is not a synonym for more sensors. Adding channels that all measure the same physical effect gives you more data and no more insight.
The point is selecting a combination of measurement domains where each one covers what the others cannot see. Vibration handles mechanical severity. ESA and EMI handle the electrical story that precedes it. Thermography screens for heat. Oil analysis reads the chemistry. Process and performance data tells you whether what you are seeing is an asset fault at all, or an operating condition being misread as one.
Cutsforth's condition monitoring systems are designed to be deployed individually or combined, with InsightCM bringing the resulting measurements into a single view so analysts can correlate across domains instead of switching between disconnected tools.
Measurement Domains Compared
| Measurement Domain | Typical Failures Detected | What It Adds to the Others |
|---|---|---|
| Vibration | Imbalance, misalignment, looseness, bearing and gear faults | Quantifies mechanical severity and trends progression |
| Electrical Signature Analysis (ESA) | Rotor bar cracks, winding faults, insulation weakness | Detects faults weeks before vibration shifts |
| Infrared Thermography | Lubrication loss, frictional heating, electrical hot spots | Rapid screening for thermal anomalies |
| Electromagnetic Interference (EMI) | Corona, arcing, partial discharge, insulation degradation | Detects developing faults months in advance |
| Oil Analysis | Contamination, viscosity loss, elemental wear, water ingress | Reveals chemical and particulate wear |
| Process and Performance Data | Operating condition, performance degradation, abnormal load | Separates asset faults from operating-condition effects |
Read across the right-hand column and the pattern is clear. The value is not in any single row. It is in what the rows do for each other:
- Broader failure mode coverage. Each domain captures a different physical effect of degradation.
- Earlier detection. ESA and EMI lead vibration by weeks to months on the failure modes they are sensitive to.
- Higher diagnostic confidence. When an anomaly appears in one domain, cross-verification in another tells you whether it is real or environmental. Fewer false alarms and fewer missed warnings.
- Better analytics inputs. Models trained on multiple domains have the context to identify root cause, not just flag an anomaly.
This is also the position taken by international standards. ISO 17359, the general guideline for condition monitoring and diagnostics of machines, treats condition monitoring as a multi-technique discipline spanning vibration, temperature, contamination, performance, and other parameters rather than any single measurement.
Coverage Math: 22 Failure Modes on One Motor
The argument gets concrete when you count failure modes on a real asset class. Industry FMEA analysis identifies 22 distinct failure modes for a medium-voltage motor. Cutsforth combines that analysis with input from experienced subject matter experts to build Integrated Diagnostic Models that map each failure mode to sensor type, diagnostic strength, criticality, and sensor placement.
Most failure modes can be detected by more than one sensor family, so the useful question is not whether a sensor can see a given fault but how strongly. The chart below scores diagnostic strength on a one to nine scale across six sensor families.
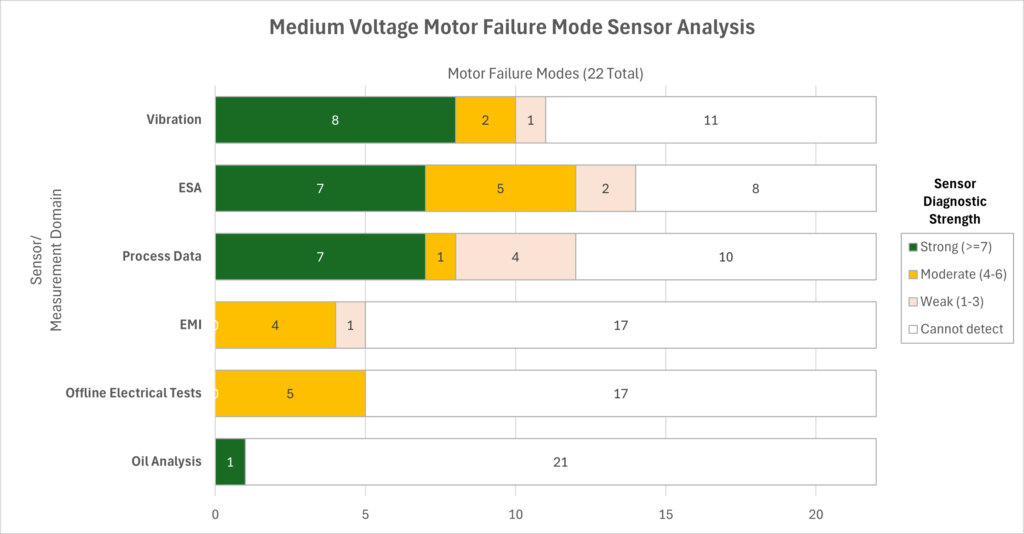
Sensor diagnostic strength across 22 medium-voltage motor failure modes.
Look at the white portion of each bar. Vibration cannot detect 11 of the 22 modes at all. ESA cannot detect 8. EMI and offline electrical tests each miss 17. Oil analysis covers one mode strongly and nothing else. Every measurement type has a blind region, and no row on that chart gets close to full coverage on its own. Broad, reliable coverage is only available through combination.
Two Stories From the Field
The Vacuum Pump That Did Not Need a Rebuild
At a continuous-process chemical operation, a vacuum pump on a distillation column was instrumented with vibration sensors at three positions plus a differential pressure sensor across the suction-side filter.
Vibration analysis returned a textbook cavitation picture: vane-pass harmonics, an elevated noise floor at impeller excitation frequencies, and a rising true-peak impact trend. On that evidence alone, the obvious next action was to pull the pump.
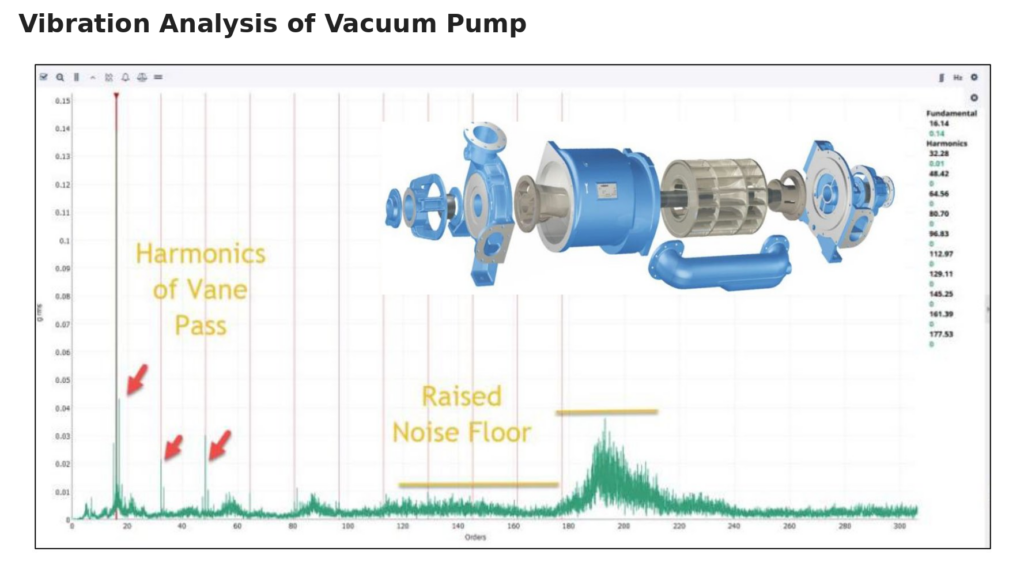
Vibration analysis of the vacuum pump showing vane-pass harmonics and a raised noise floor.
The differential pressure sensor told a different story. Filter pressure was climbing. Correlated with input from operations, the team traced the cavitation upstream to misconfigured valving that was allowing moisture intake. The fix was a valve adjustment, not a pump rebuild, and cavitation diminished within days.
Vibration named what was happening at the pump. Process data named why it was happening.
The Motor Nobody Was Watching
The same plant monitored a vertical boiler feedwater pump with vibration, temperature, head pressure, and discharge pressure. Vibration flagged misalignment through a dominant 2x running speed with harmonics. Discharge pressure tracked seal wear over time, and the operations team learned to use that trend as a scheduling trigger for seal replacement rather than reacting to leaks.
What the program did not have was electrical signature analysis on the motor driving the pump. That motor eventually tripped on over-amperage and went to the shop, most likely with rotor bar damage and electrical eccentricity of the kind ESA tracks weeks to months ahead of an over-amperage event.
Vibration and process data caught the pump-side story completely. The domain that was missing was the one that would have caught the motor-side story early enough to plan around. The cost of an absent modality is rarely zero.
Why AI Needs More Than One Signal
Artificial intelligence is being positioned as the answer to the retiring-expert problem, and the underlying premise holds up. Pattern-matching across many signals can surface subtle changes faster and more consistently than any individual engineer.
But analytics inherit the ceiling of the data underneath them. Trained on a single measurement domain, a model can find subtler vibration patterns than a human would, and still cannot see anything vibration does not measure. Give it multi-physics data and the picture changes: more inputs, genuine cross-verification, and root-cause identification rather than an anomaly score.
That distinction matters in practice. There is a real difference between analytics that name a failure mode and explain the reasoning behind the call, and a dashboard that produces a number nobody can act on. The measurement architecture is what determines which one you end up with.
Getting Started With Multi-Physics Monitoring
You do not need to instrument everything at once. The practical path starts with a small number of decisions:
- Start with criticality. Identify the pumps, compressors, motors, and turbines whose unplanned failure cascades through the operation. Those assets justify broader coverage.
- Map failure modes to domains. For each critical asset class, look at which failure modes your current sensors detect strongly, which they detect weakly, and which they miss entirely.
- Add the domain that closes the biggest gap. On motors and generators that is usually electrical. On pumps it is often process data. Let the gap analysis choose, not the vendor.
- Unify the data. Measurements that live in separate tools do not cross-verify each other. Bringing them into one platform is what turns multiple domains into one diagnosis.
Cutsforth's reliability services team works with plants to assess current monitoring practice, identify coverage gaps by asset class, and design programs that close them. For the full technical treatment of the approach described here, see the white paper Beyond Vibration: Unlock Prescriptive Reliability with Multiphysics Condition Monitoring.
Vibration monitoring remains essential for the mechanical faults it was built to find. On the assets that matter most, it should not be working alone. The right combination of measurement domains finds more failure modes, finds them earlier, and supports more confident decisions, which is what shifts the balance from reacting to failures toward planning around them.
Talk with a Cutsforth expert about where the gaps are in your current program.
About the Author

John Pasquarette is a product and marketing leader with a long track record in industrial technology, engineering software, and IoT sensing. He has led product and marketing teams at companies including Cutsforth, National Instruments and Monolith, where his work has centered on helping engineers and manufacturers turn sensor data and analytics into better decisions. Based in Austin, Texas, he writes and speaks on condition monitoring, predictive maintenance, and the Industrial Internet of Things.